

© Khunaspix Dreamstime.
Global schedule reliability has become more seasonal, while weekly liner service deployments have grown increasingly volatile since the pandemic, according to new analysis by Sea-Intelligence.
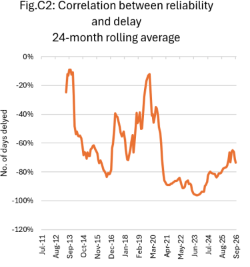
Drawing on its Global Liner Performance database, which tracks monthly vessel arrivals from July 2011 to September 2026, the consultant found a stronger relationship between declining punctuality and the severity of delays, at , alongside more pronounced seasonal fluctuations in reliability.
While declining reliability has historically been associated with longer delays, the correlation between the two measures has shifted to a lower sustained level since the pandemic, indicating a tighter relationship between whether vessels arrive late and the magnitude of their delays than was evident before.
Source: Sea-Intelligence
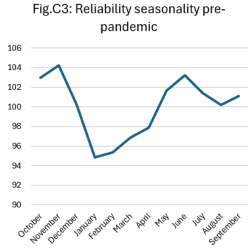
Sea-Intelligence also identified a marked change in the seasonal pattern of global schedule reliability.
Before the pandemic, between 2013 and 2019, reliability typically fell in the early months of the year, improved through spring and early summer, dipped slightly in late summer, before reaching another peak in October and November.
Source: Sea-Intelligence
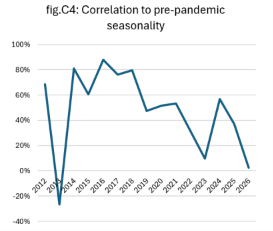
However, the alignment of individual years with this established seasonal pattern has deteriorated since 2020.
Source: Sea-Intelligence
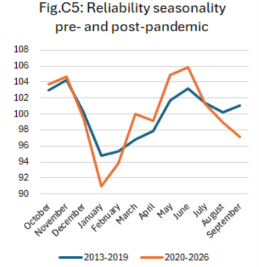
Comparing average monthly reliability across the two periods, Sea-Intelligence found that seasonal fluctuations have become more pronounced, with lower reliability at the start of the year and higher performance peaks during the summer. The consultant said the overall pattern had become more extreme compared with pre-pandemic conditions.
Source: Sea-Intelligence
Separate Sea-Intelligence analysis found that the number of weekly services operated on the main Asia-Europe and transpacific trades had become considerably more volatile.
Using its Trade Capacity Outlook database, Sea-Intelligence measured weekly service numbers on four major routes: Asia-North America West Coast; Asia-North America East Coast; Asia-North Europe; and Asia-Mediterranean.
The analysis accounted for fluctuations caused by new service launches and cancellations, blank sailings, schedule slippage, and seasonal or niche services. To measure changes in operational consistency, the consultant calculated the annual standard deviation in weekly service numbers as a percentage of the average number of services operated.
The results showed a clear upward shift from 2020 across all four trades, indicating greater uncertainty about how many services would actually operate from one week to the next.
The increase was particularly pronounced on the Asia-Europe routes, where variability rose more sharply than on the transpacific.
Comparing average variability in 2013-2019 with 2020-2026, Sea-Intelligence found that Asia-North America East Coast experienced the smallest increase, at 26%, while Asia-North Europe recorded the largest, at 78%.
The findings have implications beyond the planning challenges faced by cargo owners and logistics providers, as greater week-to-week fluctuations in service numbers also make it harder for container terminals to plan resources and manage workloads, as the number of vessels and volume of cargo requiring handling can change significantly.
Sea-Intelligence warned that this increased the risk of sudden congestion, which could, in turn, undermine schedule reliability further.
Watch the latest episode of The Loadstar Podcast News in Brief to hear more detail about the current dynamics of the ocean freight market!